The signal plot feature provides you with an always up-to-date preview on the signal values being specified in Arttests textual test specification language.
There are a variety of paradigms in use to specify signals. In Arttest, signals are either defined using imported data or a textual specification language. In contrary to other formats, a textual specification provides most flexibility with respect to compatibility with versioning systems in use, readability and excahngeability with parties without access to the testing tool and the felxibility to add explanations to the semantics.
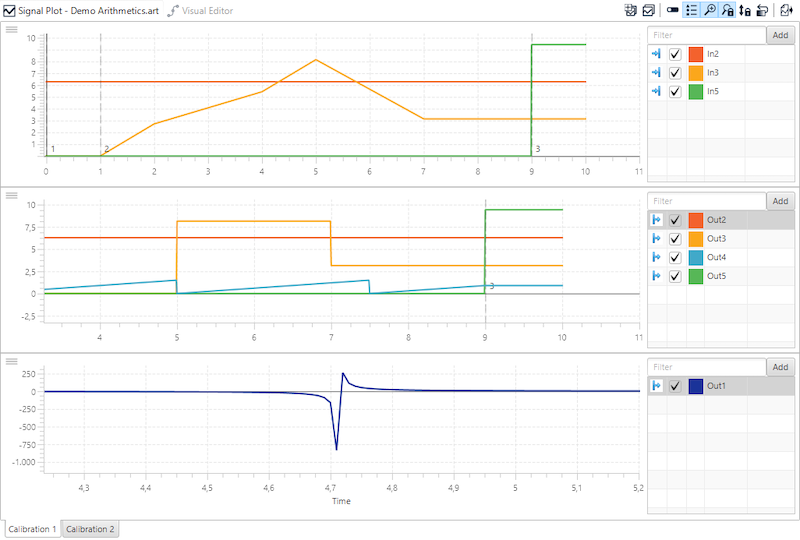
The signal plot visualizes a preview of the specified signals, giving the tester a live plot expressing his most recent activity when modifying test data. Besides stimulus data, the plot is able to visualize the tolerances specified for the outputs of the system under test. Thus, the signal plot extends Arttests benefits of a textual specification with content completion and syntax highlighting by the benefits of a graphical representation of signal values.
The plot can be configured according to your specific needs to increase clarity of the visualization ans productivity. Signals can be grouped into subplots either manually or automatically, hidden or colored according to specific needs.
Increase the visual power of the signal preview using a decoupled window on a second screen to show the plot.